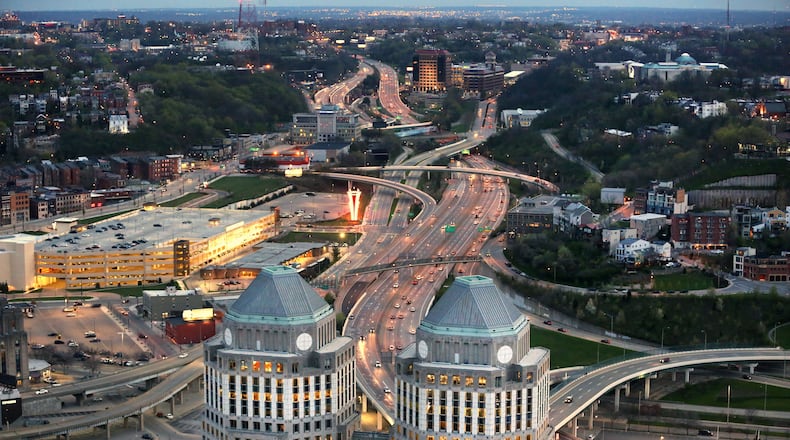
But that's nowhere near as bad as is it is Boston, Washington, D.C., Chicago, New York and Los Angeles, the top five most congested cities in the nation, all of which see delays of between 128 and 164 hours a year lost in congestion, according to INRIX, a Seattle-based transportation data group that puts out an annual global traffic scorecard.
The company, which analyzed peak and off-peak travel times to determine the number of hours lost in congestion during rush hour, ranks the Queen City better than 25th-ranked Columbus, which finds motorists stuck in their vehicles for 71 hours a year.
MORE: A new highway interchange just opened in Mason to improve travel, access to businesses
The cost of congestion per driver in Cincinnati is $834, but elsewhere, it’s much worse. In Boston drivers lost up to $2,291 per year due to congestion, followed by Washington D.C. ($2,161), Seattle ($1,932), Chicago ($1,920) and New York City ($1,859). Wichita, Kansas, had the lowest cost of congestion among the U.S. cities studied at $304 per driver.
“Congestion costs Americans billions of dollars each year. It will continue to have serious consequences for national and local economies, businesses and citizens in the years to come,” said Trevor Reed, transportation analyst at INRIX. “If we’re to avoid traffic congestion becoming a further drain on our economy, we must invest in intelligent transportation systems to tackle our mobility challenges.”
The traffic, which is a result of factors including weather, construction and infrastructure issues, is getting better in some of the largest cities nationwide, but not all areas are as fortunate.
MORE: ‘American Ninja Warrior’ to film outside in downtown Cincinnati this spring
Nationally, drivers lost an average of 97 hours in congestion last year, according to the INRIX report.
Time lost to traffic congestion in Cincinnati increased 3 percent between 2017 and 2018, the report determined. Cincinnati drivers need about four minutes to travel the “last mile” during peak travel times, moving at 16 mph.
Peak speed during peak travel times in Cincinnati is 29 mph, with off-peak times listed at 38 mph and “free-flow” traffic at 45 mph.
Peak speed is the worst portion of the morning and afternoon commute and off-peak is the low point between the peak commuting periods, according to Mark Burfeind, of INRIX. Free-flow is the best performance experienced over 24 hours.
ODOT projects to help alleviate traffic include the I-75 Thru the Valley project, a nearly $600 million seven-phase project stretching eight miles from Ohio 126 (Ronald Reagan Highway) to just south of I-275 and includes a I-75 lane addition, resurfacing and interchange work.
MORE: Local hospitals ranked among tops in the nation. What does that mean for patients?
There’s also the I-75 Mill Creek Expressway, a 12-phase, 8-mile, nearly $650 million project from the Paddock Road Interchange to the Western Hills Viaduct that includes a lane addition and resurfacing. It also includes improvements to the interchanges at Hopple Street, I-74, Mitchell Avenue, the Norwood Lateral and Paddock Road.
While the report provides a snapshot of the economic costs of congestion in cities, it does not reflect the impact of the time loss for individuals of different incomes, according to the INRIX study.
“Boston may incur the most significant costs in dollar terms, but a robust public transit system means alternatives exist for lower-income households,” the study said. “In contrast, in a city like Houston (up to $1,365), many households depend on driving, which is more expensive on a per mile basis.”
About the Author

